![]() English
English
APPLICATION OF GEOSTATISTICAL METHODS FOR SPATIAL ANALYSIS OF SOIL DATA
Nikos Karapetsas, Ph.D. student, Aristotle University, Department of Agriculture, Lab of Remote Sensing and GIS, G.R. 54124, Thessaloniki , Greece, e-mail: karapets@agro.auth.gr, Ioannis Gitas, Lecturer, Aristotle University, Department of Forestry and Natural Environment, Lab of Forest Management and Remote Sensing, G.R 54124, Thessaloniki, Greece, email: igitas@for.auth.gr Kostas Duros, Ph.D. student, Aristotle University, Department of Agriculture, Lab of Remote Sensing and GIS, G.R. 54124, Thessaloniki , Greece, e-mail: kostasduros@in.gr , Haralabos Topaloglou, M.Sc. student, Aristotle University, Department of Agriculture, Lab of Remote Sensing and GIS, G.R. 54124, Thessaloniki , Greece, e-mail: babistop@yahoo.gr, Eleftheria Moutziki, M.Sc. student, Aristotle University, Department of Agriculture, Lab of Remote Sensing and GIS, G.R. 54124, Thessaloniki , Greece, e-mail: moutziki@agro.auth.gr
ABSTRACT
Modern opinions for the agricultural activities are conditioned by the viability in the use of soil resources, and accordingly are required, in detail, knowledge of quality, extent and geographic distribution of soils of each region. The prediction of soil attributes or parameters in places for which data have not been acquired is often necessary as well as the recording of all relevant soil information. The GIS environment gives us the ability for storage and statistical analysis of the resulting data, as well as for the prediction of soil attributes, and the imprinting of this information in form of thematic maps. This paper presents the application of geostatistical methods in the mapping procedure of soil parameters, in Lagada region of Thessaloniki Prefecture. My regards to the Soil Science Institute of Thessaloniki and the Director Dr. Papadopoulo, for allowing the use of the specific data in my M.Sc. and Ph.D. thesis.
KEY WORDS: GEOSTATISTICS, KRIGING, GIS
I. INTRODUCTION
The project of soil mapping of Thessaloniki Prefecture, which began in 1999, is implemented mainly for the confrontation of problems that are related with the rational use of fertilizers, plant-protection products and waters, the protection of soil, surface and underground waters as well as the production of high quality of products. Problems such as, the choice in the readjustment of crops, the rational use of fertilizers, the efficient irrigation and drainage of soil, the protection of soil from the erosion which has devastating consequences in the environment, the improvement of problematic soil and generally the rational exploitation of territorial resources, require for their solution the existence of soil map.
The mapping of soils is a work of inquiring nature and it is carried out in the field by soil scientists-cartographers, whose the conclusions are confirmed with laboratory analysis of sampled data, having as final goal the classification of the soils and the syntax of the soil map. The soil map presents the various categories of soils that exhibit similar attributes. Soil mapping often includes wide scale work in the area, aiming at the realisation of sampling of soils and the recording of several observations relative to the physiographic characteristics of the survey area.
The soil mapping of Thessaloniki Prefecture, at its first stage of implementation included a survey in the wider region of Lagada. Initially the study on the survey area was carried out from a geographic, geomorphologic and finally a pedologic point of view. During the field work certain soil attributes from several soil augers were studied, including grain size distribution, drainage, CaCO3 content, color, degree of erosion and slope. The interpretation of the above data was followed by the determination of the cartographic unit and the detail mapping of the boundaries of each cartographic unit on maps with scale 1:20000, according to the field observations.
The mapping effort of the soils and their attributes in a Geographic Information System, besides the fulfilment of the essential objectives of a soil map project, which are the storage and management of information regarding the attributes and the use of soils, gives us the opportunity of broadening the research field. The estimation of various soil attributes, the study of their spatial distribution and their imprinting in thematic maps are essential for a thorough understanding of the existing environmental situation. But knowledge of soil attributes is of a little importance unless the spatial location of measurements is known and accounted for in the analysis. The investigation of suitable methods and their application in the case of soil mapping of Lagada region, was the main aim of this work. The suitable tools originate from the field of Geostatistics, which it is a branch of statistical science that accounts for the spatial dimension in the study of phenomena.
III. METHODS
The formation of a soil is, in a sense, the resulting effect of climate, vegetation and time, in the parent material in different locations of the landscape. The variation of soil attributes in all three dimensions of space is consequently a physiological result of the effect of all factors that affect the soil formation [6]. Most approaches in the study of soil variability require usually the adoption of a model, capable of describing with clarity the soil differentiation in the landscape. In an ideal case, we would have in our disposal all those extensive and detailed descriptions of the natural phenomena that take place and relate to the soil attributes. Thus, having satisfactory knowledge of the mechanisms that differentiate the measurement values in the natural environment, and importing all these information in a model of deterministic nature, we could ultimately repeat the phenomenon [8].
Actually,
although the regularity, that we might distinguish from point to point in the
landscape for soil attributes, the fundamental physicochemical phenomena that
take place are so complex, that their deterministic modelling has been
impossible in any scale [5]. The approach in the estimation of soil attributes
with the information that is provided by the soil map, is inadequate to reveal
the form of soil fluctuation with clarity. In that case, it is useful to see the
data as expression of regionalized variables. According to the theory of
regionalized variables the available sampling data result from random functions,
introducing a degree of probability or uncertainty to the estimation of soil
attributes [7]. This statistical approach, for the estimation of a phenomenon,
is often called geostatistical. Kriging is a generic name adopted
by the
statisticians for a family of
estimation methods governed by a basic idea: estimate a value of a continuous
soil attribute z at an unsampled location
![]() as a linear combination of
as a linear combination of
![]() neighboring observations:
neighboring observations:
![]()
I. The case of Lagada region
The region of the survey was the agricultural region of Thessaloniki Prefecture, which is extended from Lagada to the region of Lake Koronia and the fringes of the surrounding hills (Figure 1). The samples were realised during the year 1999 from a team of surveyors from Soil Science Institute of Thessaloniki, aiming at the construction of the soil map of the region. The spatial positions were received with use of handheld GPS. The sampling methodology was the stratified random, adapted according to the on spot observations, on the basis of physiographic characteristics, such as hydromorphy, slope and the erosion of region. For the surface layer of the soil (roughly 30 cm.) and for the reception of a complete and representative sample, the soil was taken from 3 different neighbourhood points.
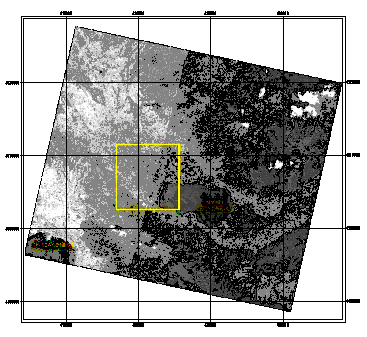
Figure 1. The location of the survey area (IRS-Panchromatic)
The samples that were acquired from the survey were supplemented by the analytical data that resulted from the description of several soil profiles. The total of sampling locations for analysis reached 189, while the total for verification 46. The method of Kriging interpolation was applied for the estimation of specific soil parameters in the region of Lagada. The application was realized with the use of appropriate software, inside Geographic Information Systems. For this goal the following two different software with possibilities of geostatistical analysis were used: α) Spatial Analyst 2.0 as extension of ArcView 3.2 (ESRI Soft.), β) GS+ Geostatistics for Environmental Sciences 3.11 (GammaDesign Soft). Both these software process raster data in ArcINFO format, while at the same time the use of these software simultaneously, gives the possibility of a careful verification of the results that each one derives, eliminating thus the existence of errors due to imperfections of software.
I. The case of organic matter
In the case of organic matter, the experimental semivariograms were created with a lag distance h=100 m. The revealed spatial correlation and its range is obvious. From the comparison of different equations that were used to model the spatial variation of organic matter, it appeared that the exponential model presents the best fit, as it results from the method of cross-validation and the coefficient correlation[3][4]. The range of 2 km represents a range of spatial correlation realistic enough for the case of organic matter even if the corresponding active range (6 km) is rather excessive, under the scale of observation that is used. Also the fitting of the rest of the models is close enough to this of the exponential model, something that indicates the appropriateness of the applied functions for the experimental semivariogram, with the condition the existence of a satisfactory spatial correlation[6][7]. The individual characteristis of each model that was applied appear in Table 2.
Table 2. The individual characteristics of each model in the case of organic matter
|
Model |
Nugget Co |
Sill C |
Range α |
RMSE |
|
Exponential |
0.036 |
0.1 |
2090 |
0.011 |
|
Linear |
0.685 |
0.082 |
7450 |
0.050 |
|
Cyclic |
0.057 |
0.08 |
6850 |
0.012 |
|
Gaussian |
0.063 |
0.068 |
4710 |
0.013 |
The diagrams of cross-validation method, with the corresponding semivariogram, appear analytically below. The Orinary Kriging interpolation method was carried out, for the prediction of the percentage(%) of organic matter content in the soil. The spatial resolution of the interpolation was determined in 30x30 m and on the basis of the extent of the survey area, the prediction was realized in 57.508 points. The number of neighbouring points that were used for the estimation in each point, were 16 within a radius of at least the 3 km. The results of the prediction as well as the relevant uncertainty were impressed in the form of maps, with the use of Spatial Analyst 2.0 in environment ArcView 3.2. Verification of the predictions was based on the use of values that were removed from the initial set of observations(which was used for the estimation), and with the calculation of indicators ME (mean error) MSE (mean squared error).[1][2] The results appear in the Table 3. The various models are shown in Figures 3-11.
Table 3. Results for verification of predictions for organic matter
|
Number of interpolation data |
Number of verification data |
ΜΕ |
MSE |
|
189 |
45 |
0.121 |
0.163 |

Figure 12. The prediction (left) and the uncertainty (right) in the case of soil organic matter content.
V. DISCUSSION
The application of a geostatistical method for the prediction of the selected soil parameter in the region of the study, reveals important information on the spatial variation of soil attributes. Given the existence of spatial correlation, that was detected in the case of organic matter, the prediction and the corresponding variability of the prediction error, can be obtained, as the application of the method O.K was characteristic. This is owed, in a big degree, in that the spatial fluctuation of the contained organic matter in the soil, is of such a scale that it is impressed by the sampling that took place in the region of study.
Completing the geostatistical approach in the study of the soil attribute that was selected, we would say that method O.K constitutes the simpler geostatistical method, as the research so much in the theory what in the practical part, it is found in rapid development [3]. From the appearance of geostatistical methods in soil science, in the beginning of decade 1980 up to today, have been developed tens variants of the method which have been published in the international journals and in the international bibliography, giving the stimulus for the applied research in this sector [8].
VI. BIBLIOGRAPHY
[1]Burgess T.M., Webster R., and McBratney A.B., 1981. Optimal interpolation and isarithmic mapping of soil properties. IV Sampling strategy. Journal of Soil Science Vol.32, pp 643-659.
[2]Burgess T.M., Webster R., 1980. Optimal interpolation and isarithmic mapping of soil properties. I The semi-variogram and punctual kriging. Journal of Soil Science Vol.31, pp 315-331.
[3]Burrough P.A., 1997. Environmental Modelling with Geographical Information Systems. Proceedings from 4th National Conference on GIS Research UK Innovations in GIS 4. Taylor & Francis.
[4]Bishop T.F.A., McBratney A.B., 2001. A comparison of prediction methods for the creation of field-extend soil property maps. Geoderma Vol.103, pp 149-160.
[5]Cressie N.A.C., 1993. Statistics for Spatial Data. J.Wiley & Sons Inc.
[6]Goovaerts P., 1999. Geostatistics in Soil Science: state-of-the-art and perspectives. Geoderma Vol.89, pp 1-45.
[7]Goovaerts P., 1998. Geostatistical tools for characterizing the spatial variability of microbiological and physico-chemical soil properties. Biol. Fertil. Soils. Vol 27. pp 315-334.
[8]Heuvelink G.B.M., Webster R., 2001. Modelling soil variation: past, present, and future. Geoderma Vol.100 pp 269-301.
